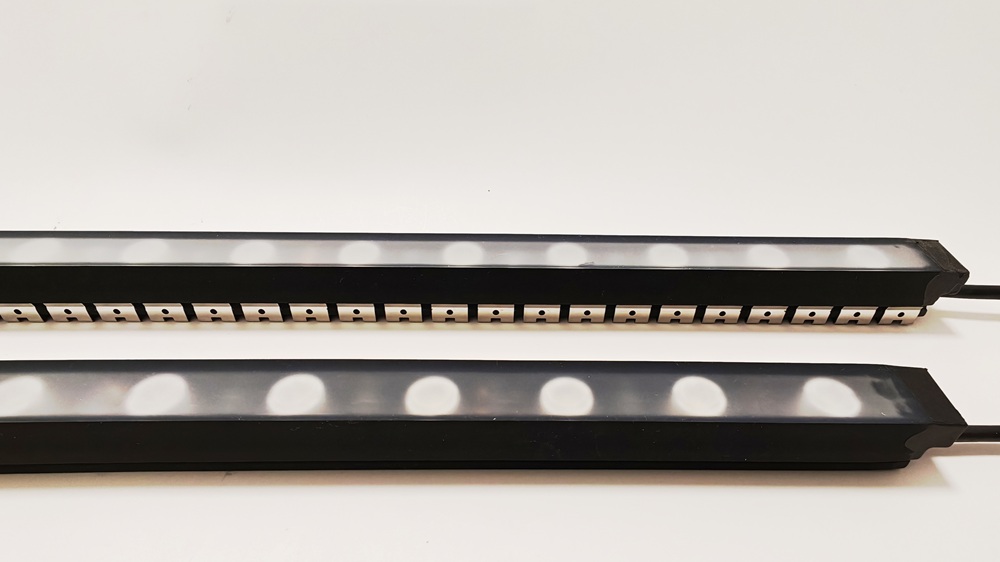
An integrating sphere report can reveal far more about an LED wall washer than a headline lumen figure. It records how much light the sample produces, how much power it consumes, the measured white point, the spectral distribution, and how accurately it renders colors. For lighting designers, importers, contractors, and OEM buyers, learning to read these values makes it easier to compare products on evidence rather than marketing language.
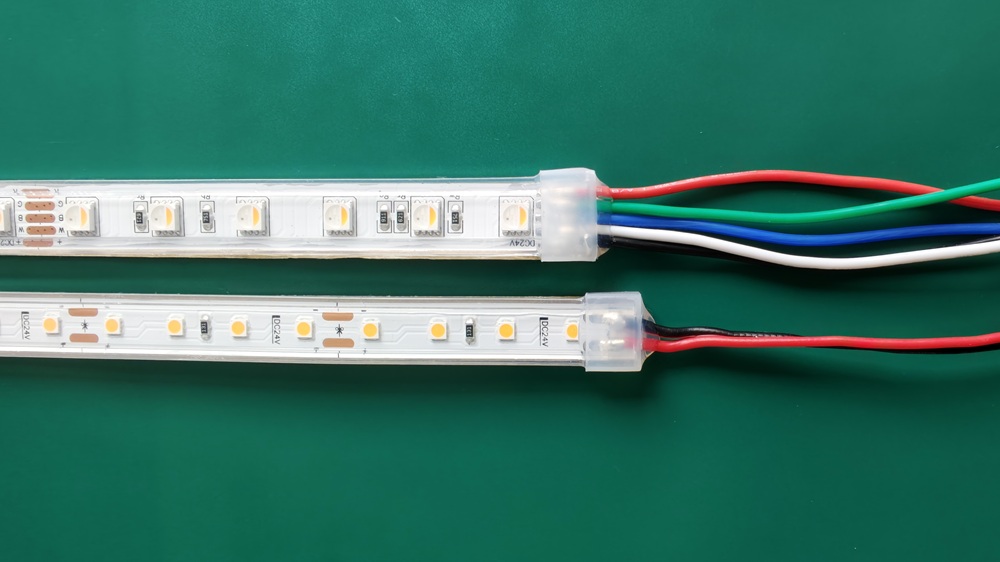
This guide uses a real one-meter test of Yiholight’s YH-WW2527V24 flexible LED wall washer as a practical example. The tested sample was a nominal 6000K, CRI 90+ configuration operated at approximately 24V. All results in this article apply only to that sample under the recorded test conditions; they should not be treated as guaranteed values for every color temperature, lens, production batch, or wall washer model.
What Does an Integrating Sphere Measure?
An integrating sphere is a hollow measurement chamber with a highly reflective inner surface. Light emitted by the test sample is repeatedly reflected inside the sphere, allowing the measurement system to collect light coming from many directions. A spectrometer then analyzes the spectrum and calculates photometric and colorimetric values.
For an LED wall washer, a sphere report can normally provide:
– luminous flux in lumens
– electrical voltage, current, and power
– luminous efficacy in lumens per watt
– correlated color temperature
– chromaticity coordinates
– Duv, which describes deviation from the blackbody locus
– general CRI and individual rendering indices
– spectral power distribution
– selected TM-30 summary values, when supported by the software
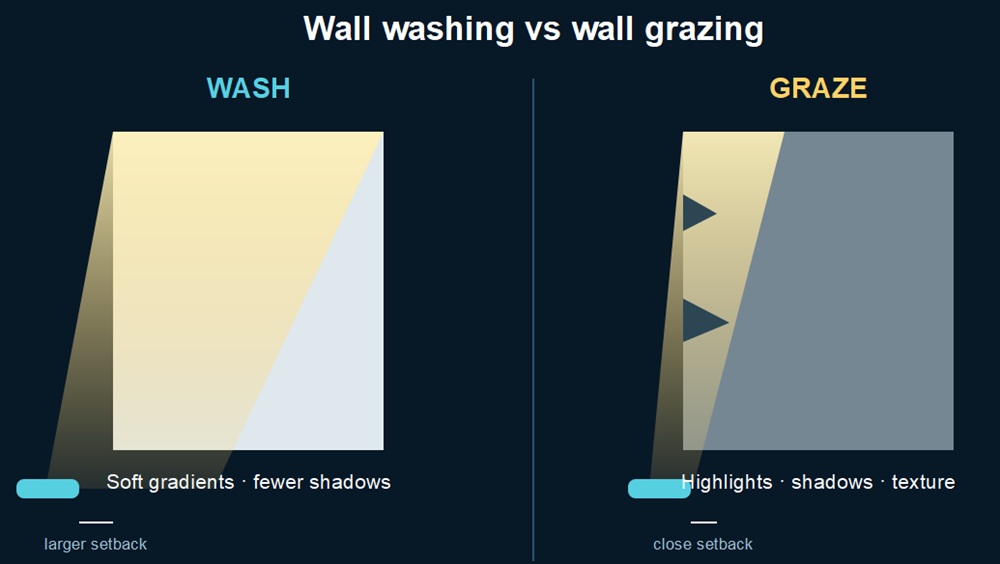
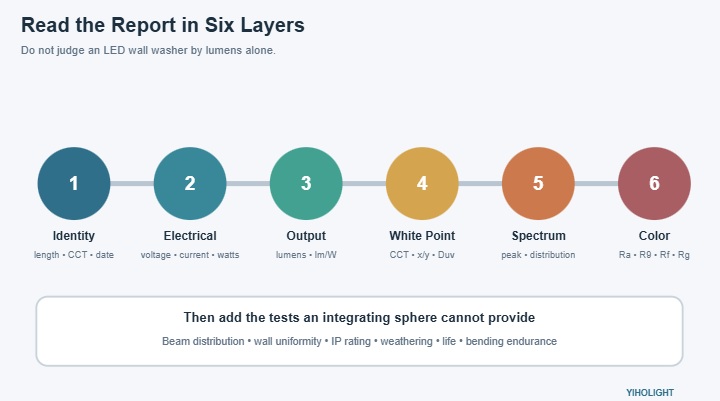
However, an integrating sphere does not show where the light goes. It cannot replace a goniophotometer or photometric distribution file for beam angle, candela distribution, wall coverage, throw distance, or uniformity. This distinction is especially important for wall washers because optical control is just as important as total lumen output.
Tested Sample and Recorded Conditions
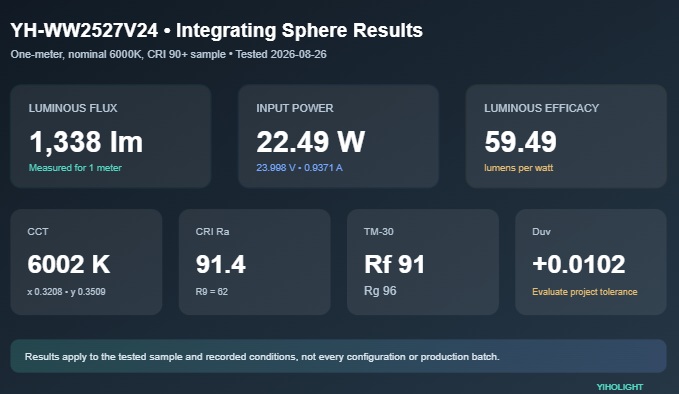
The report records a one-meter YH-WW2527V24 sample test. The nominal configuration was 6000K with CRI 90+, and the measured ambient humidity was 65%.
- Sample length 1 meter
- Input voltage 23.998V DC
- Input current 0.9371A
- Input power 22.49W
- Luminous flux 1,338lm
- Luminous efficacy 59.49lm/W
- Correlated color temperature 6,002K
- CRI Ra 91.4
- TM-30 fidelity index Rf 91
- TM-30 gamut index Rg 96
- Chromaticity x, y 0.3208, 0.3509
- Duv +0.0102
- Peak wavelength 452.4nm
- Radiant flux 4.643W
Because the tested length was one meter, the measured 1,338 lumens and 22.49 watts can also be read as approximately 1,338lm/m and 22.49W/m for this specific sample. That conversion would not be valid if the report covered a different length.
Begin with Voltage, Current, and Power
The sample operated at 23.998V and drew 0.9371A. Multiplying voltage by current gives approximately 22.49W, matching the reported input power:
> 23.998V x 0.9371A = approximately 22.49W
This agreement is a useful basic consistency check. It confirms that the electrical values in the report describe the same operating point.
The measurement is close to the nominal 24V supply expected for the YH-WW2527V24 family. Buyers should still confirm the intended driver, maximum run length, cable size, voltage drop, and feed arrangement for the final project. A one-meter sphere test does not predict the voltage at the far end of a long facade run.
The report displays a power factor of 1.000, but the sample was measured from a DC supply. This value should not be used as the AC-input power factor of the external LED driver. Driver efficiency, power factor, harmonic performance, and mains compatibility require the driver’s own data or a separate system-level test.
Read Luminous Flux as Total Visible Output
The measured luminous flux was 1,338 lumens for the one-meter sample. Luminous flux describes the total quantity of visible light weighted to the sensitivity of the human eye. It is useful for comparing the overall output of two samples tested under equivalent conditions.
Lumens alone do not determine wall-washing performance. A product with more total lumens may still create weaker vertical illumination if its lens spreads light too widely or directs part of the output away from the target surface. Conversely, a lower-lumen wall washer with an appropriate beam can produce a more useful result at the required mounting distance.
When comparing reports, verify that the following are the same:
– sample length
– nominal CCT and CRI option
– operating voltage and power
– lens or beam configuration
– diffuser or housing color
– stabilization time
– test temperature
If those conditions differ, the lumen values are not a clean like-for-like comparison.
Understand Luminous Efficacy
The report calculates a luminous efficacy of 59.49lm/W:
> 1,338lm / 22.49W = approximately 59.49lm/W
Luminous efficacy indicates how effectively the tested assembly converts electrical input into visible light. It is not the same as LED chip efficacy. The measured assembly includes optical losses from encapsulation, the black body, lenses, internal reflection, the selected spectrum, and other construction factors.
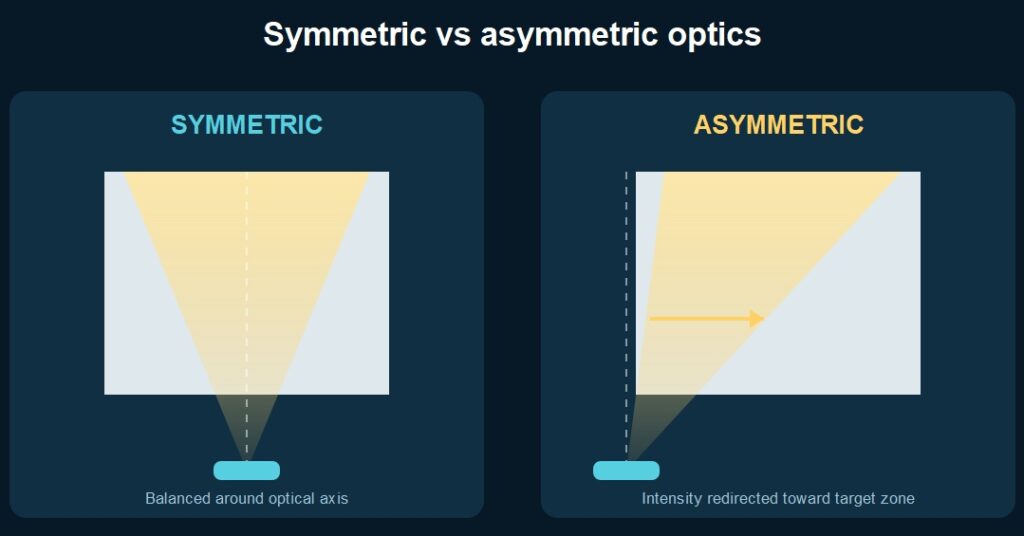
For a wall washer, efficiency must be balanced with optical performance, flexibility, sealing, color quality, and mechanical design. A narrow or asymmetric optic may be selected to deliver useful light to a wall rather than maximize the raw lumen value inside a sphere.
Use lm/W to compare products only when their intended function and test conditions are sufficiently similar. A flexible lens wall washer should not be judged against a bare indoor LED board as if they were equivalent assemblies.
Check CCT Against the Nominal White
The sample was identified as a nominal 6000K product, and the measured correlated color temperature was 6,002K. This is very close to the nominal target in numerical terms.
CCT describes whether white light appears warmer or cooler. It does not fully describe tint. Two sources can both measure close to 6000K yet look different because one sits above and another below the blackbody locus. That is why CCT should be read together with chromaticity coordinates and Duv.
For exterior architecture, cooler white can emphasize modern surfaces, metal, pale stone, and certain facade concepts. The correct CCT still depends on local regulations, surrounding lighting, material color, client preference, and environmental considerations.
Use Chromaticity and Duv to Evaluate Tint
The measured CIE 1931 coordinates were x = 0.3208 and y = 0.3509. The report also gives u’ = 0.1953 and v’ = 0.4807. These coordinates locate the measured white point on standard color spaces.
The reported Duv was +0.0102. A positive Duv means the chromaticity lies above the blackbody locus and may appear greener than a source at the same CCT with a Duv closer to zero. Whether this is acceptable depends on the project’s color tolerance, comparison sources, viewing conditions, and applicable specification.
This value should not be hidden behind the fact that the CCT is almost exactly 6000K. It shows why a professional buyer should evaluate CCT and Duv together. For projects requiring tight white consistency, request the target chromaticity, SDCM or binning tolerance, and acceptance range across production batches.
The instrument output also shows an “OUT” classification. Because the report does not identify the tolerance window configured in the software, this label alone should not be interpreted as a universal pass or fail. The project team should compare the coordinates and Duv with its own approved limits.
Interpret the Spectral Power Distribution
The spectral chart shows a pronounced blue peak at 452.4nm followed by a broad phosphor-generated band across green, yellow, orange, and red wavelengths. This is a familiar spectral shape for a phosphor-converted white LED.
The report lists a peak full width at half maximum of 18.8nm. It also records a dominant wavelength of 511.4nm and color purity of 4.0%, values calculated by the measurement software for the white source.
The shape of the spectrum influences color rendering. A smooth, well-balanced spectrum generally supports more natural rendering, while missing or weak regions can reduce the appearance of particular colors even when the general CRI remains high.
Look Beyond General CRI
The measured general color rendering index was Ra 91.4, which places the sample in the CRI 90+ category under the recorded conditions. Ra is calculated from the first eight test color samples, so it does not tell the complete story.
For facade stone, concrete, metal, and general architectural surfaces, Ra may be a useful starting point. For projects involving red brick, artwork, merchandise, hospitality finishes, skin tones, or branded colors, review the individual indices and a physical mock-up under the intended light.
Read TM-30 Rf and Rg Together
The report provides two TM-30 summary metrics:
– Rf = 91: an overall color fidelity score, where a higher value indicates closer similarity to the reference illuminant.
– Rg = 96: an average gamut score. A value near 100 indicates similar average saturation to the reference; below 100 suggests a modest average reduction in saturation.
Together, Rf 91 and Rg 96 indicate good overall fidelity with slightly reduced average saturation for this sample. They provide a broader view than Ra alone, but they are not a complete TM-30 analysis.
A full TM-30 report normally includes additional information such as the color vector graphic, hue-bin fidelity and chroma-shift data, and local color rendering behavior. Because those pages are not present in this integrating sphere report, the article should not claim that the complete TM-30 evaluation has been reviewed. Yiholight can publish a separate technical analysis when the full TM-30 report is available.
Know Which Values Are Secondary for Wall Washing
The report includes a radiant flux of 4.643W, a photosynthetic photon flux of 20.471 micromoles per second, and 400-700nm radiometric output of 4,466.4mW. These radiometric and photon-based quantities can be important in horticultural or scientific applications.
For architectural wall washing, lumens, electrical power, white point, color rendering, beam distribution, and vertical illuminance are usually more directly relevant. The presence of extra values in software output does not mean every metric should become a sales claim.
A Test Report Is Most Valuable When It Is Read Critically
The one-meter YH-WW2527V24 sample produced 1,338 lumens at 22.49W, with measured efficacy of 59.49lm/W, CCT of 6,002K, Ra of 91.4, TM-30 Rf of 91, and Rg of 96. The report also highlights details that deserve project-level evaluation, particularly Duv +0.0102 and R9 of 62.
That balanced interpretation is the purpose of an LED wall washer integrating sphere test report: not simply to collect attractive numbers, but to understand the tested product’s electrical, photometric, and color behavior within clearly stated limits.
For facade, landscape, hospitality, retail, or custom architectural projects, contact Yiholight with the required CCT, CRI, beam angle, run length, control method, mounting geometry, and environmental conditions. The Yiholight team can recommend a suitable wall washer configuration and provide the relevant technical information for project evaluation.
Learn more:
How to Customize LED Strip Lighting: A Complete OEM & ODM Guide
How to Choose the Right LED Strip Light for Your Project
This shelf lighting is magic: transform your space with LED strip lights
As a bespoke lighting solution provider, Yiholight specializes in high-quality LED strips and neon flex. Our products are engineered for durability, brightness, and ease of installation—trusted by B2B customers across the globe.
Contact us today to explore the best LED lighting for your business!
© [Yiholight] and [www.yiholight.com]. Unauthorized use or duplication of this material is strictly prohibited without express written permission from the site’s author or owner. Excerpts and links may be used, provided full, clear credit is given to [Yiholight] and [www.yiholight.com], with appropriate, specific direction to the original content.